Monitoring visitors inside live chat software
In real life, when you call out a name, you really want to have responses as soon as possible. Customers ask you a request (Request chat) have the same thoughts. Subiz sees clearly that demand and create the report about Waiting time. It measures the time visitors get replied and the unit is second.
Subiz records Customer wait time every conversation. All you need to do is go to tab History, click Export to download chat data under csv file. You can open csv file by Excel or Notepad.
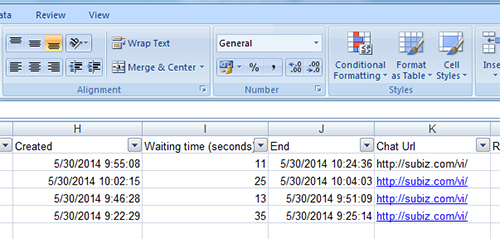
Export History file from Dashboard
Usually, csv file is created to let you easily login to another tool to measure. It’s pretty hard to see directly on csv file. I will introduce you a simple way to report waiting time by Google Drive.
Sign in to Google Drive (Google Doc) and go to Copy of Subiz – Waiting time Tool and Chart . Make a copy and save to your Drive.
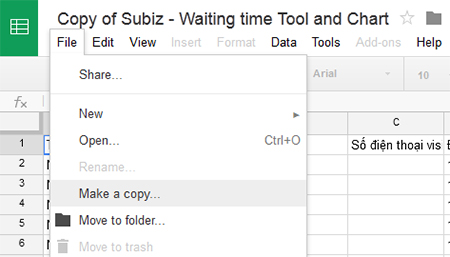
Make a copy to Google Drive
Next, login to Google Drive and open file “Copy of Subiz – Waiting time Tool and Chart”. Switch to Sheet “history” to clear old data. Start importing Subiz’s data you’ve just downloaded above into this sheet.
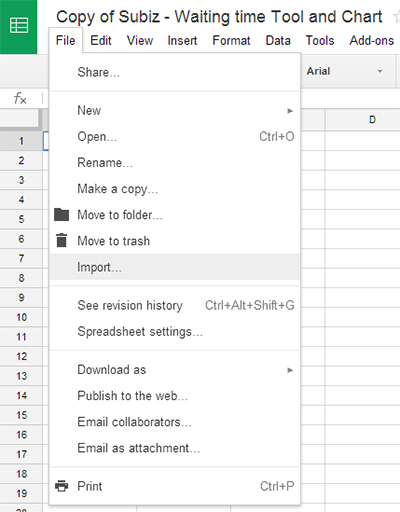
Import Chat history to Copy of Subiz – Waiting time Tool and Chart file
Choose Upload and upload file History:
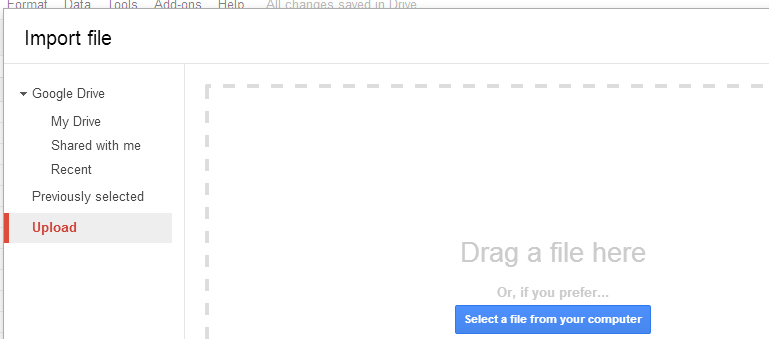
Upload History to Google Drive
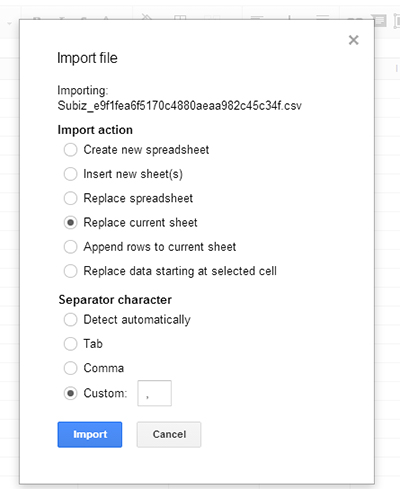
Setting Import file
In import window, Import action, choose “Replace current sheet”. In Separator character, choose Custom and add comma (,)
Now, move to Sheet Chart to see the chart.

Chart about Waiting time according to agent
With this tool, you can create more charts or functions suit your report.
Subiz suggests you using Waiting time as one of the important KPI to manage the support activities. You should create the report once a week or once a month.


